Schools
Huyett: NH School Districts Cheated On Their Mandatory Reports To Voters — Act Now To Hold Them Accountable
Litigant: SAUs tell voters the same thing annually: taxes are going up to pay teachers. It's a sympathetic argument and a lie in many SAUs.
Every year, New Hampshire school districts tell voters the same thing: school taxes are going up to pay teachers. It’s a sympathetic argument. It’s also, in many districts, a lie.
This year, when state law finally required them to publicly post their spending trends, several districts illegally manipulated the data. At least three went even further, manufacturing entirely fake numbers.
Find out what's happening in Nashuafor free with the latest updates from Patch.
New Hampshire’s school districts have been unaccountable for so long that many believe they are above the law. To hold them accountable, the culture of the right in New Hampshire needs to change. Local conservatives have to be willing to engage in conflict and litigation, or these districts will keep cheating with impunity.
Sen. Keith Murphy’s Students First Act, codified as RSA 189:75-78, which went into effect this year, requires school districts to post a mandatory report showing standardized, inflation-adjusted graphs of their 10-year spending trends—cost-per-pupil, teacher pay, and administrator salaries—at least seven days before voters approve their budgets.
Find out what's happening in Nashuafor free with the latest updates from Patch.
Under RSA 189:77, if districts fail to obey the law, any local taxpayer can go into court and obtain his own reasonable attorney’s fees from the school district. The taxpayer can also hold the district accountable by obtaining an injunction, a declaratory judgment, and any other equitable relief as appropriate.
Yet school districts are not eager to comply. The charts often give a striking picture of rising costs, rising administrator pay, and stagnant or declining teacher pay. This year, many school districts opted to break the law and risk litigation rather than suffer the embarrassment of posting a candid report.
In at least a dozen school districts, schools manipulated each y-axis to distort the visual scale and/or crowded the report with additional material. Both of those tricks are explicitly prohibited in the RSA 189:76. And, in at least three districts, there is compelling evidence that administrators published fictional numbers in bad faith.
Cornerstone represented local clients in some districts and successfully demanded that the schools correct their mandatory reports at least seven days before their budget vote. But violations are so widespread that we haven’t been able to address them all. Activists in other districts must step up—which they can do at no cost thanks to the attorney’s fees provision in the law. And while most budget votes have already occurred, RSA 189:77 still allows taxpayers to obtain a declaratory judgment against school districts.
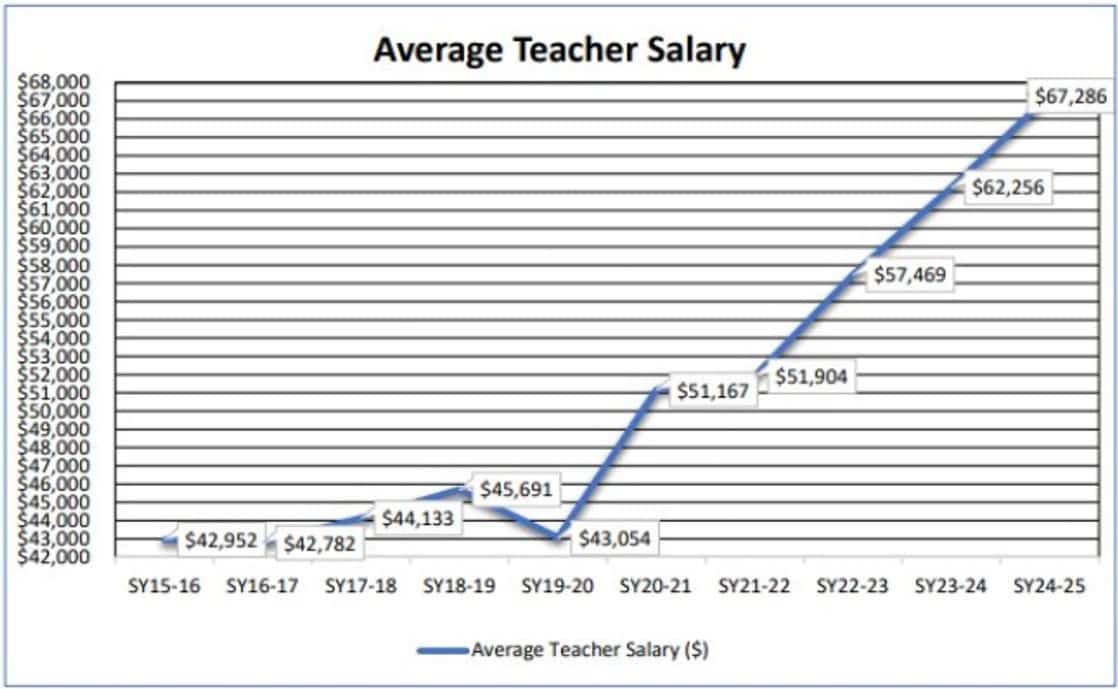
Chester and Mont Vernon committed two of the most severe violations that have not been addressed as of this writing. Consider Chester School District’s mandatory report to voters. In its teacher salary graph, Chester showed a steady upward trend in compensation over the past decade—the kind of reassuring picture that tells voters their teachers are being taken care of. The problem is that the numbers Chester used in that graph are entirely fake.
On the left is the graph of teacher salaries posted by the Chester School District. On the right is an accurate, inflation-adjusted graph created using numbers that Chester reported to the NH Department of Education (DOE) in each year.
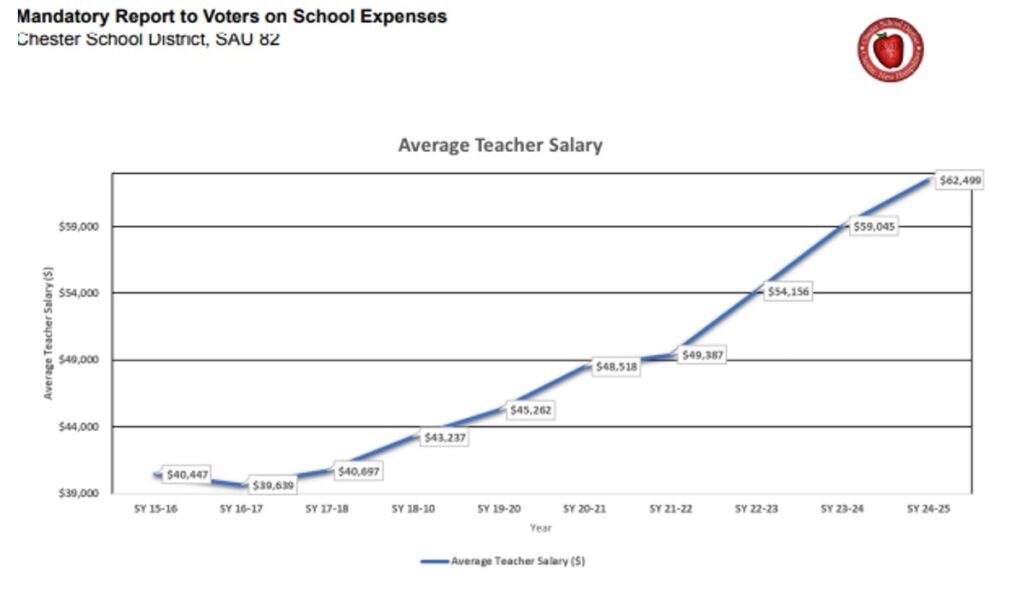
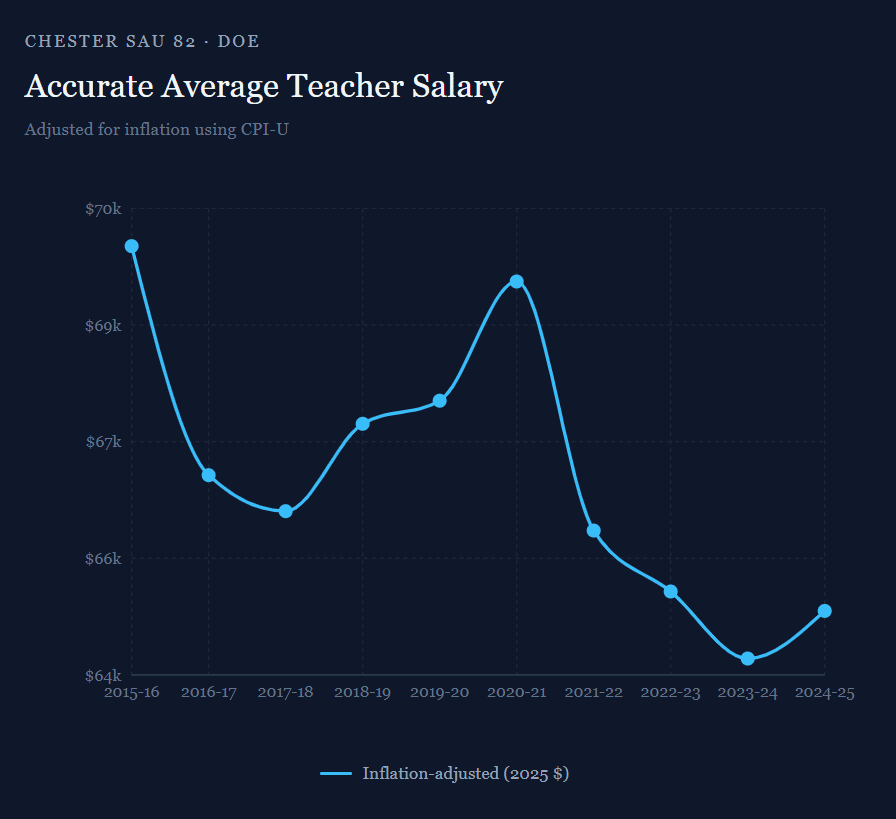
Official graph of the Chester School District at left. Accurate graph at right.
The reality is that Chester’s real teacher pay declined while costs and administrator compensation rose. Chester apparently found this embarrassing and so, instead of publishing the truth, created a fabricated picture of sharply rising teacher pay.
You might assume that an administrator at Chester innocently confused nominal and inflation-adjusted figures—accidentally using today’s dollars for recent years and smaller historical numbers for earlier ones. This would still be a statutory violation, but it could at least be attributed to incompetence.
That explanation doesn’t hold. The historical salary figures Chester used in the teacher pay graph are even lower than the nominal salaries Chester reported to the DOE in those same years. Any inflation adjustment would have pushed those historical numbers up. Chester pushed them further down, creating the appearance of a stark increase in teacher pay. In other words, Chester did the complete opposite of adjusting for inflation.
In contrast, Chester’s cost-per-pupil graph, in the same mandatory report, is properly inflation-adjusted: historical costs are correctly elevated to reflect the value of past dollars. Whoever prepared this report, therefore, understood exactly how inflation adjustment works, but chose to apply it correctly to one graph and fictitiously to another. There is no innocent explanation for this disparity.
Mont Vernon School District presents the same pattern. The teacher salary graph posted by the district, shown at left below, shows a dramatic upward slope. The accurate graph on the right, built from numbers Mont Vernon itself reported to the DOE, tells the story the administration didn’t want voters to see.
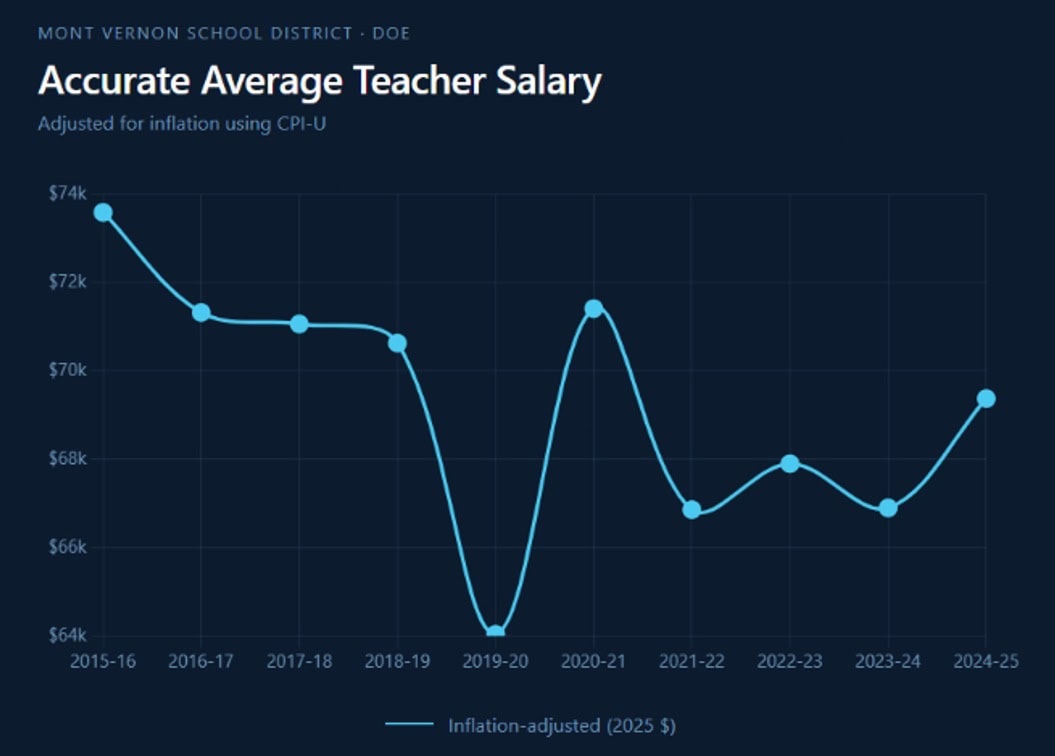
Official graph of the Mont Vernon School District at left. Accurate graph at right.
Once again, it’s not that Mont Vernon failed to adjust for inflation. Mont Vernon’s numbers are simply fake—apparently contrived to give a false impression of steeply rising real teacher pay.
Nor did Mont Vernon merely adjust for inflation improperly. Check for yourself: try taking the numbers Mont Vernon reported to the DOE over a given set of years, such as 2015 through 2018, and adjusting them for inflation. There is no good-faith way to arrive at the numbers they posted.
And, like in Chester, Mont Vernon properly inflation-adjusted its per-pupil cost numbers while contorting its teacher salary data in the opposite direction. This shows that the district understood perfectly well how to create an inflation-adjusted chart and chose not to. This is not a coincidence. This is a strategy.
Most districts did not invent outright fake numbers in the way that Chester and Mont Vernon did. However, these were far from the only districts that engaged in forms of cynical manipulation. Well over a dozen districts selectively distorted the y-axis of their charts—expanding the visual scale to emphasize rising teacher pay while compressing the scale to downplay rising costs and administrator pay.
Other districts crowded their reports with information not required by the law—such as nominal dollar numbers—to obfuscate real spending trends and confuse voters, often in combination with y-axis manipulation.
Prime sponsor Sen. Keith Murphy and his cosponsors anticipated these tricks. RSA 189:76, III and IV expressly prohibit y-axis manipulation, while paragraph VI prohibits crowding the report with additional material.
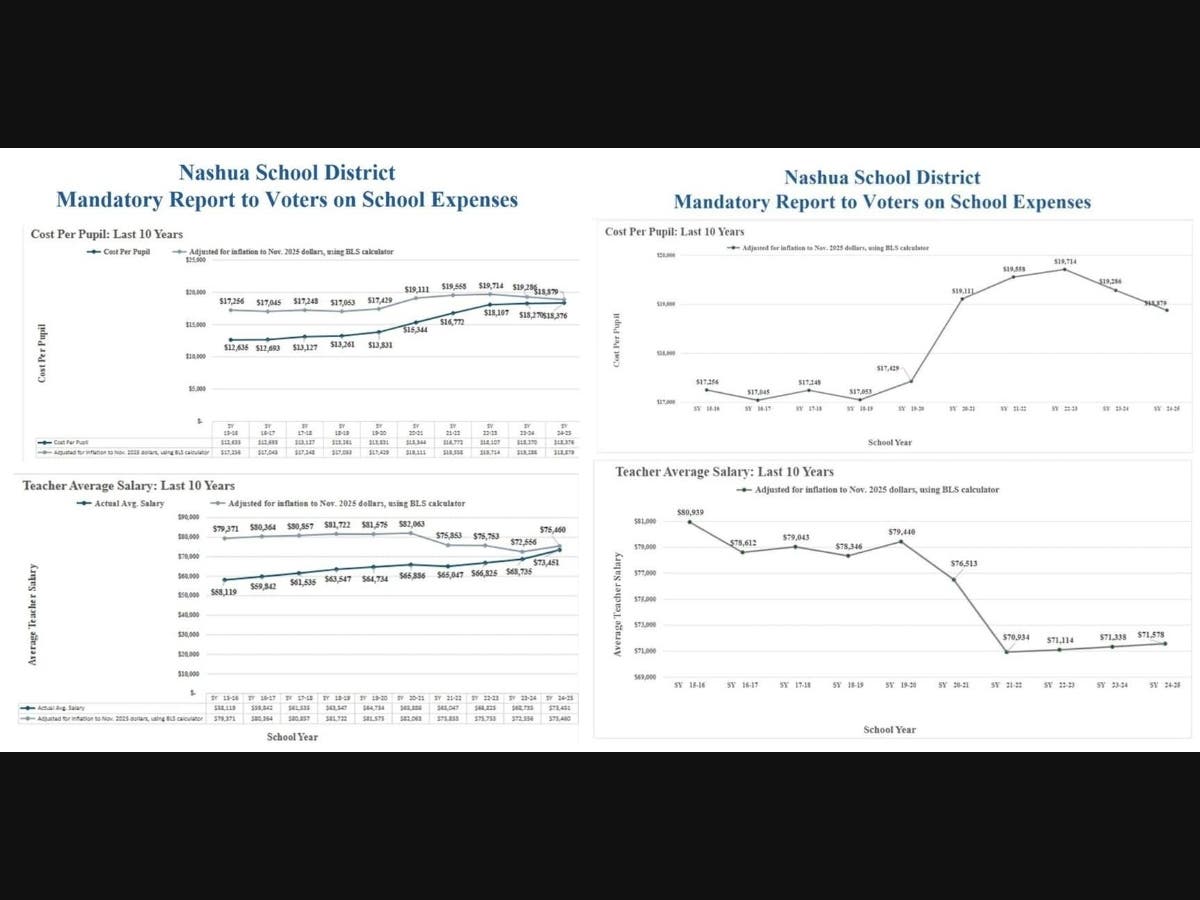
To see what difference these kinds of obfuscations can make, consider the Nashua School District’s mandatory report. According to Nashua’s own numbers, over the past decade, Nashua’s cost-per-pupil rose nine percent while its real teacher pay declined by 12 percent.
Yet in their initial report—shown at left below—Nashua chose to stretch out their y-axis, visually compressing these trendlines into relatively flat lines. Nashua also crowded the report with additional material, obfuscating the real trendline with a confusing mishmash of data. They even misleadingly labeled their nominal average salary as “Actual Average Salary.” Through clever manipulation, Nashua gave a false impression of stable costs and teacher pay.
The law’s prohibition is clear: “In each graph, the upper and lower boundaries of the y-axis must be capped at the nearest thousand dollars.” When the law is followed, line graphs must highlight relative trends over time—not compress and downplay them.
After Nashua residents Beth and Stephen Scaer invoked their legal rights and demanded changes, Nashua posted facially corrected graphs—shown at right below. The contrast between the illegal and compliant graphs is illustrative.

Original graphs of the Nashua School District at left. Corrected official graphs at right.
And while a 12 percent decline in teacher pay is hardly the most dramatic change shown in the mandatory reports, tricks like those used in Nashua can also be used to disguise almost any spending trend.
In the Northwood School District, real administrator compensation has approximately doubled over 10 years. In the same time period, real teacher pay has gone up about 10 percent even as real per-pupil spending has risen about 27 percent.
Yet in Northwood’s original report to voters, shown at left, an enormous y-axis initially compressed the graph’s visual scale, making rising administrator spending look like a gentle slope. To their credit, however, Northwood School District ultimately complied fully with the law by posting a compliant mandatory report for seven days before their budget vote, including the corrected chart shown at right.

Original graph of the Northwood School District at left. Corrected official graph at right.
Some argue that laws like the Students First Act should not rely on civil remedies, as this imposes litigation costs on the taxpayer and/or asks too much of overtaxed or weak-willed grassroots activists. Yet the major alternative—relying on New Hampshire state agencies to enforce controversial laws—has consistently failed. There are countless examples of similarly conservative-coded laws being nullified when progressive-run state agencies simply refuse to enforce them.
Until New Hampshire Republicans understand that personnel is policy, and prioritize staffing our state agencies with officials who share their values, grassroots activists will have to be less afraid of litigation and conflict. Otherwise, laws like the Students First Act cannot consistently work as intended.
If your district is in violation of the Students First Act, any attorney can represent you under RSA 189:77, challenge the district, and recover their own attorney’s fees at a net zero cost to you. Although most budget votes have already occurred, if you act now, you may still pursue a declaratory judgment—a judicial declaration that the district broke the law—as well as other equitable relief.
Cornerstone has taken on some of these districts and will continue to do so, but we can’t sue them all. And, so far, we’re aware of only two districts where a local activist has hired a for-profit attorney under 189:77.
School administrators will exist outside the rule of law if activists are unwilling to fight. Civil remedies remain the best enforcement mechanism we have. Contact Cornerstone if you have questions about the law, if you need help finding a suitable attorney, or if you are a New Hampshire attorney interested in taking on Students First referrals.
Ian Huyett is the Associate Director and Head of Litigation at Cornerstone, a Christian advocacy group in New Hampshire. He wrote this for NHJournal.com.
This story was originally published by the NH Journal, an online news publication dedicated to providing fair, unbiased reporting on, and analysis of, political news of interest to New Hampshire. For more stories from the NH Journal, visit NHJournal.com.